seasonalityPlot
seasonalityPlot package

R package for Creating Seasonality Plots of Stock Prices and Cryptocurrencies
Description
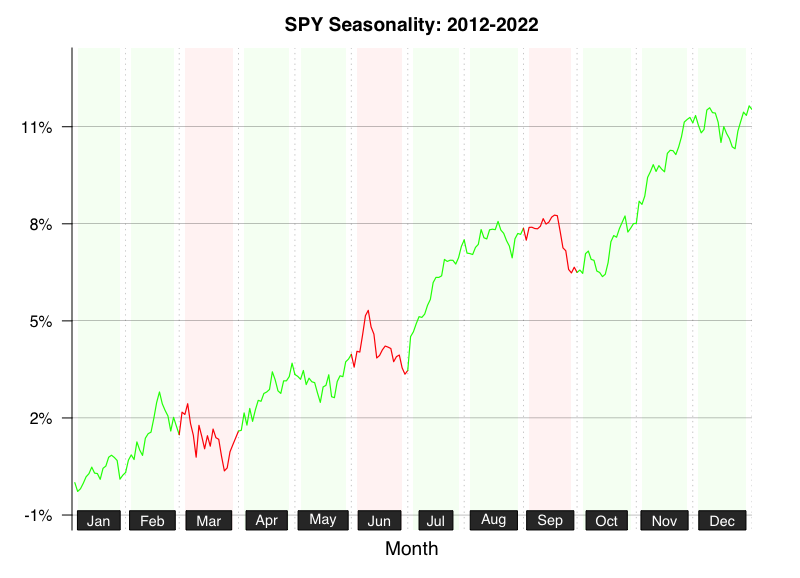
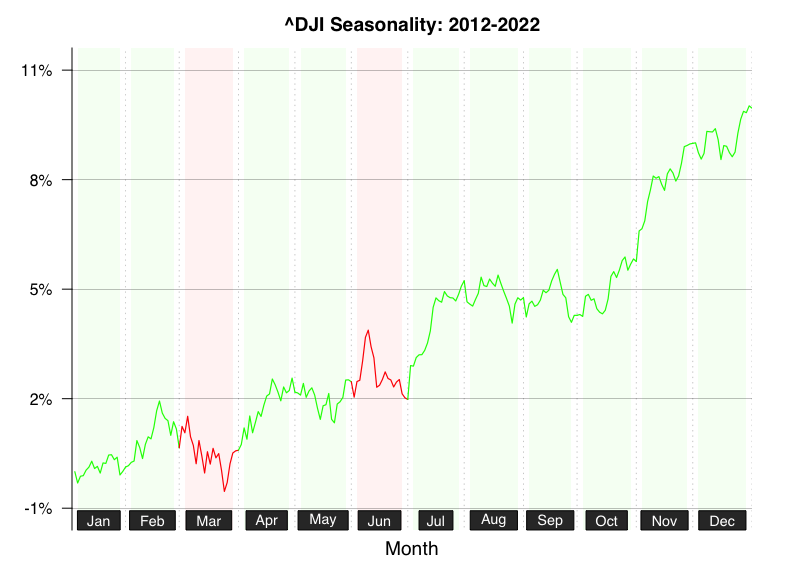
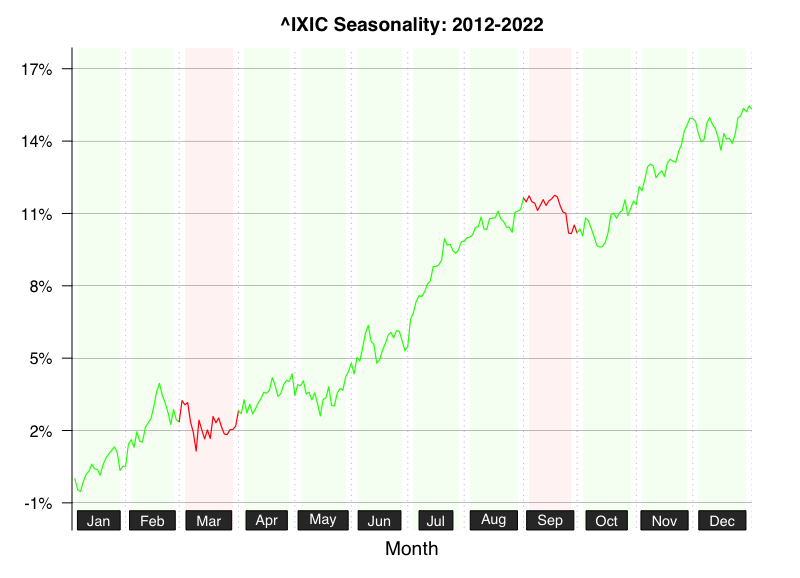
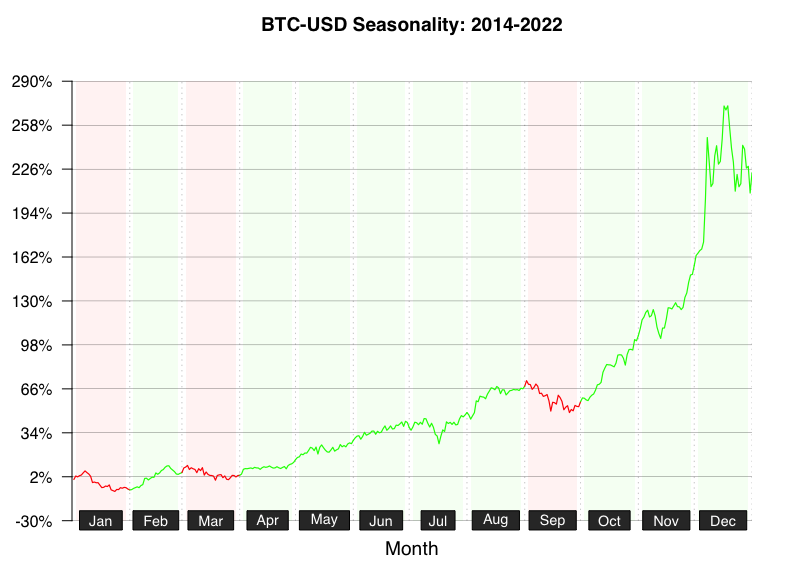
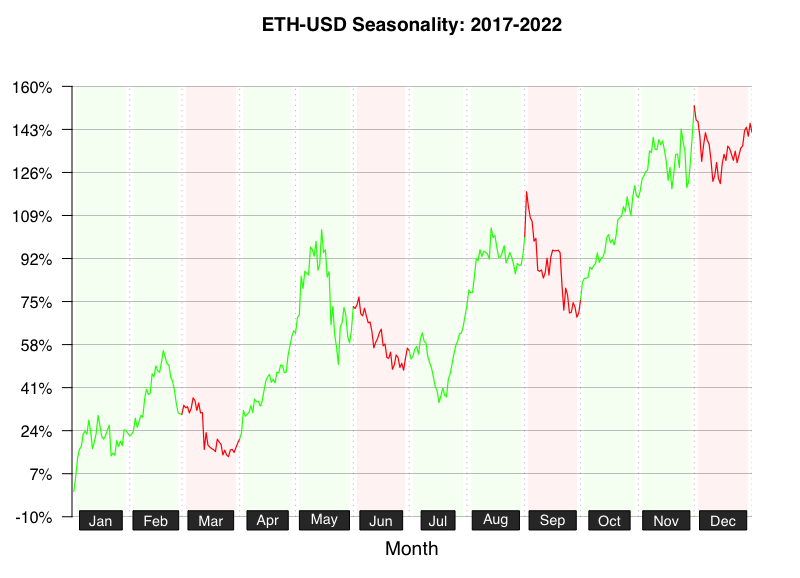
The price action at any given time is determined by investor sentiment and market conditions. Although there is no established principle, over a long period of time, things often move with a certain periodicity. This is sometimes referred to as anomaly. The seasonPlot() function in this package calculates and visualizes the average value of price movements over a year for any given period. In addition, the monthly increase or decrease in price movement is represented with a colored background. This seasonPlot() function can use the same symbols as the ‘quantmod’ package (e.g. ^IXIC, ^DJI, SPY, BTC-USD, and ETH-USD etc).
Documents and Web API
Version
1.3.1: Modify the “CryptoRSIheatmap” function (CRAN 4th version) and build the seasonalityPlot Web API on Huggingface Spaces.
1.2.1: Update seasonPlot & Add new function “CryptoRSIheatmap”.
1.1.1: Update Figures.
1.1.0: CRAN 3rd version.
1.0.1: CRAN 2nd version.
0.99.3: CRAN version.
0.99.1: Newly Published the GitHub.
Installation
install from CRAN
install.packages("seasonalityPlot", repos="http://cran.r-project.org")
install the latest from GitHub
type the code below in the R console window
install.packages("devtools", repos="http://cran.r-project.org")
library(devtools)
devtools::install_github("kumeS/seasonalityPlot")
or install from the source file with sh commands
git clone https://github.com/kumeS/seasonalityPlot.git
R CMD INSTALL seasonalityPlot
Function
-
seasonPlot: create seasonality plots for stock prices or cryptocurrencies
-
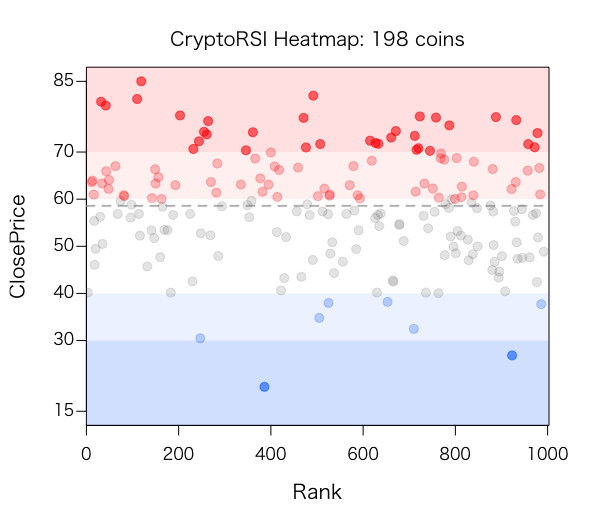
CryptoRSIheatmap: CryptoRSI Heatmap Function
Usage of seasonPlot function
library(seasonalityPlot)

#Plot an averaging seasonality of SPDR S&P500 ETF (SPY) between 2012 and 2022.
seasonPlot(Symbols="SPY")

#useAdjusted = TRUE
seasonPlot(Symbols="SPY", useAdjusted = TRUE)
#Plot an averaging seasonality of Dow Jones Industrial Average (^DJI) between 2012 and 2022.
seasonPlot(Symbols="^DJI")
#Plot an averaging seasonality of NASDAQ Composite (^IXIC) between 2012 and 2022.
seasonPlot(Symbols="^IXIC")
#Plot an averaging seasonality of Bitcoin (BTC-USD) between 2017 and 2022.
seasonPlot(Symbols="BTC-USD")
#Plot an averaging seasonality of Ethereum (ETH-USD) between 2017 and 2022.
seasonPlot(Symbols="ETH-USD")
#CryptoRSI Heatmap Function provides a heatmap visualization of RSI values for a specified number of cryptocurrencies.

CryptoRSIheatmap(coin_num = 200, useRank = 1000, n = 21, useRankPlot = TRUE, OutputData = FALSE)
License
Copyright (c) 2021 Satoshi Kume
Released under the Artistic License 2.0.
Authors
- Satoshi Kume